AI Infographic Generator: Verify the Data, Then Design the Visual
Keep verified evidence separate from an AI-generated layout draft. Learn how to prepare a traceable brief, choose the right comparison, and finish charts, typography, and source notes with human control.
·
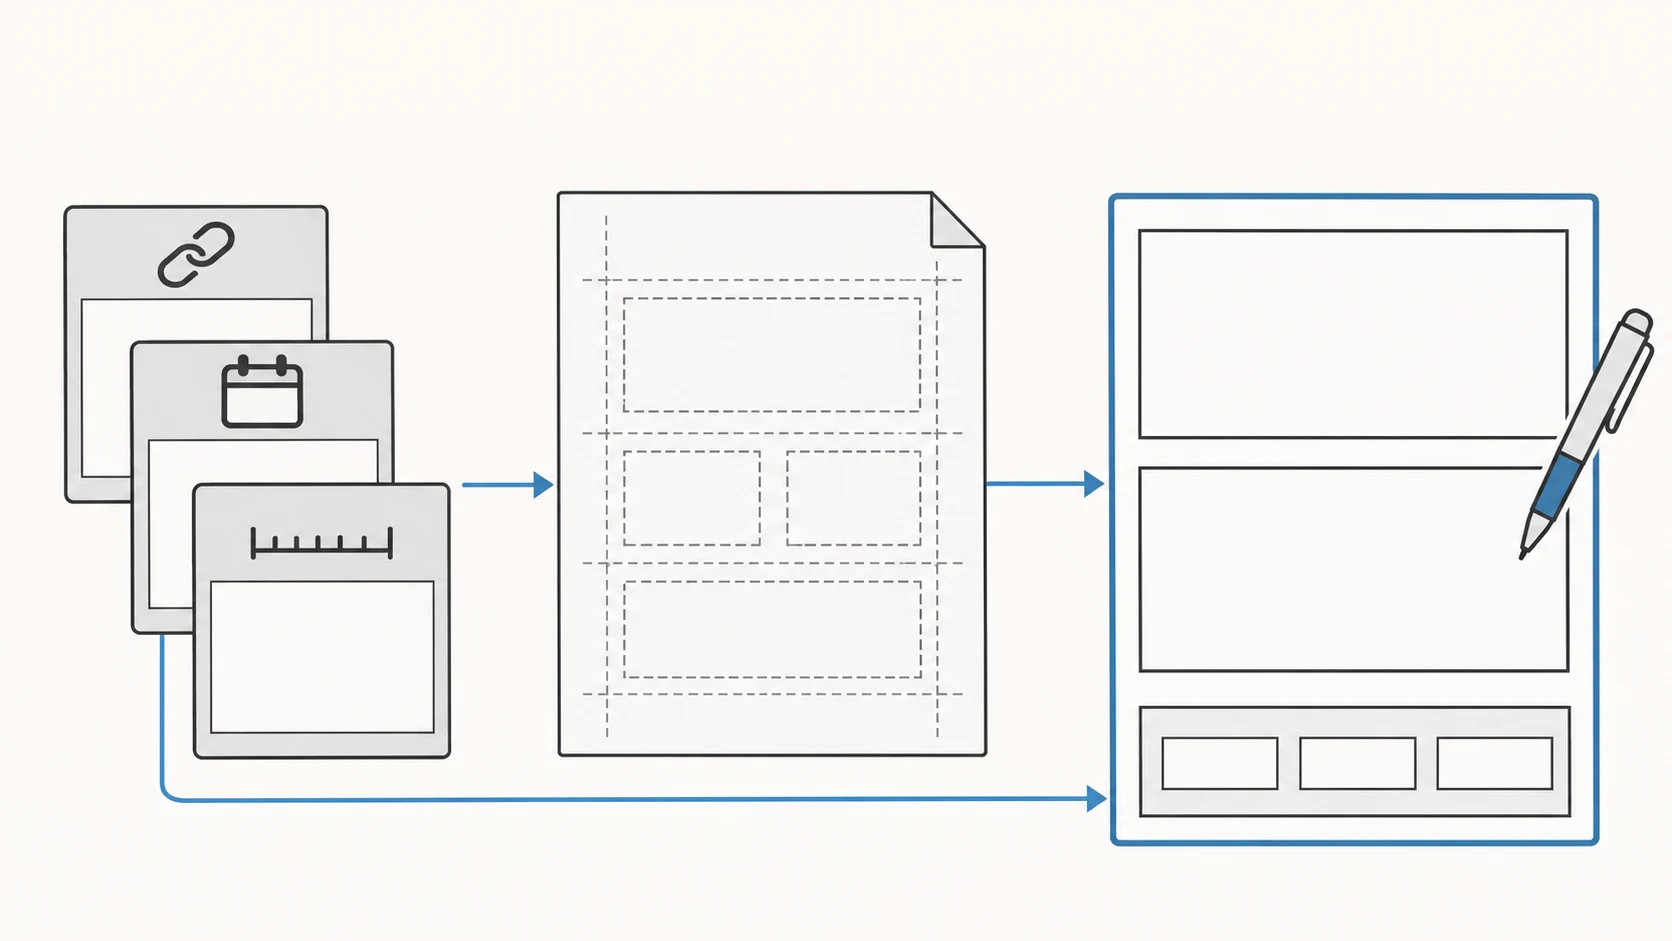
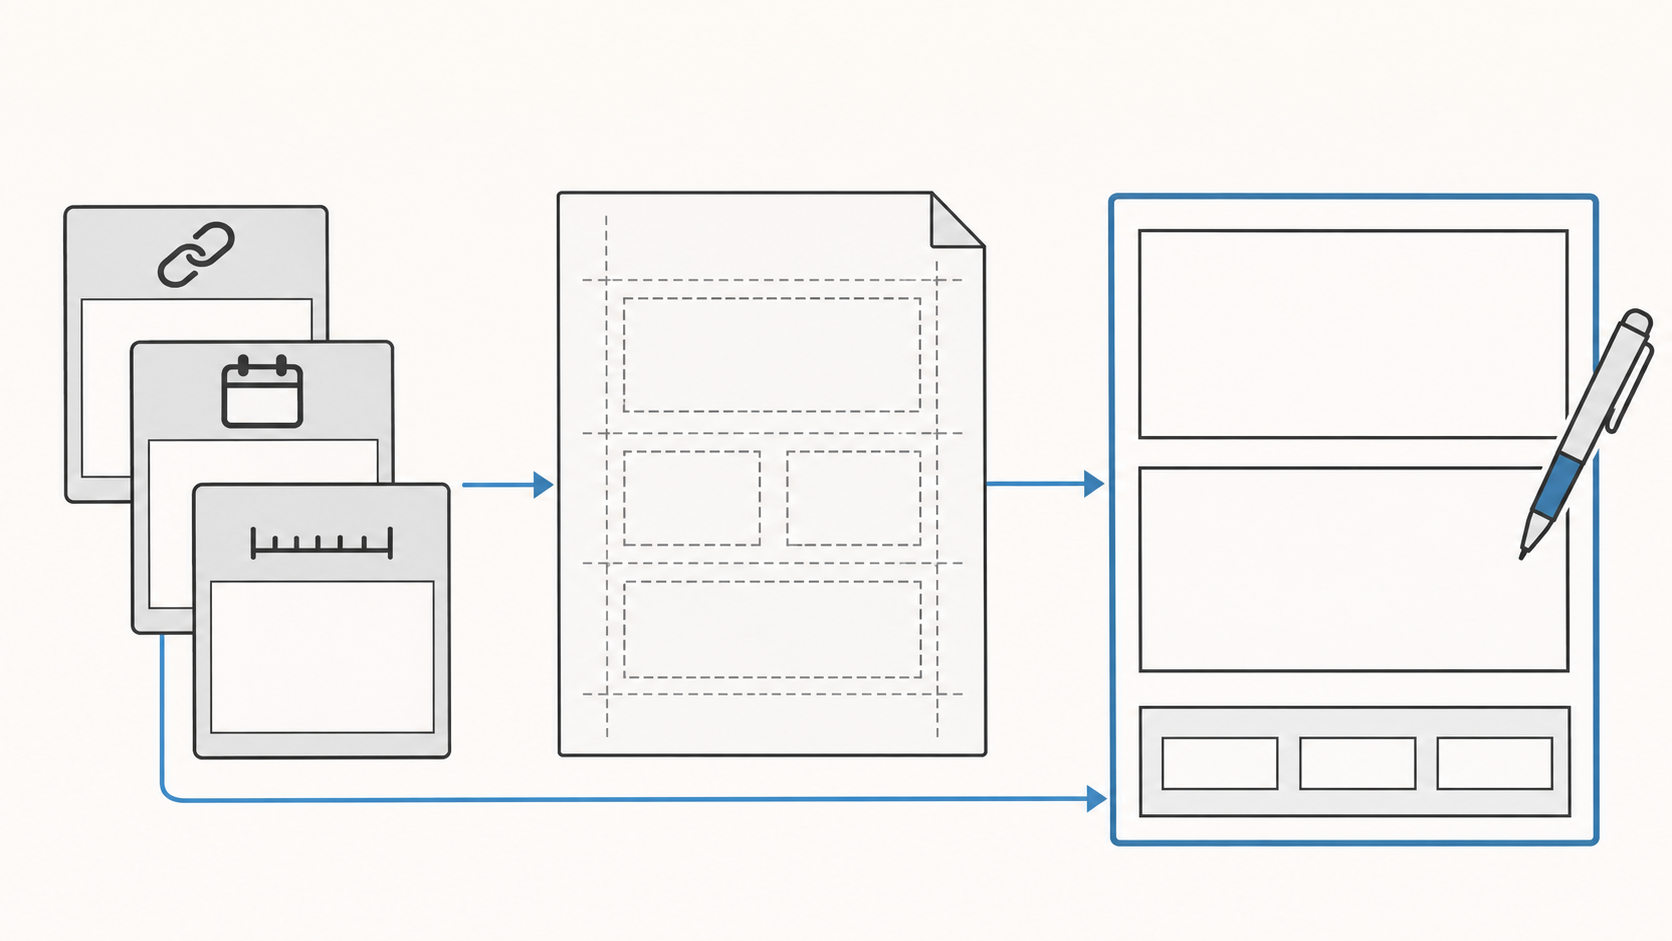
An infographic can look polished and still make the wrong comparison. An AI infographic generator can be useful for exploring hierarchy, illustration, and whitespace. Treat exact values, chart geometry, and source attribution as separate production work that you can check against the evidence.
Media.io’s infographic generator page presents text prompts as the starting point and includes sample prompts containing statistics. The page does not attach corresponding data sources to those statistical values, so they are not ready-to-use evidence for a report. A more accountable approach starts with the question your graphic needs to answer.
Decide what the reader needs to compare
“Create an infographic about growth” leaves an important decision unresolved. Does the reader need to understand an increase in total volume, a change in share, or a sequence of events? Each calls for different evidence and a different visual relationship.
Write a brief task statement first: Help this audience understand this relationship, using data from this period and scope. If you cannot complete that sentence, do not ask the model to invent the missing story.
Keep a small evidence table outside the image prompt:
| Brief item | What to record | Why it affects the design |
|---|---|---|
| Metric definition | Population, denominator, counting and deduplication rules | Establishes whether values are comparable |
| Values and units | Original values, units, and display precision | Controls labels, axes, and rounding |
| Period and scope | Dates, geography, population, or business segment | Sets the boundary of the headline |
| Source location | Original URL, table or page, publication date if available | Makes the evidence traceable |
| Gaps and limitations | Missing values, incompatible samples, unverified claims | Identifies what must remain blank or qualified |
Mark an unsupported number as unverified rather than inviting the model to supply a plausible value. If a source date is unavailable, leave it unknown. The date you accessed a webpage is not the period its data describes.
Choose the relationship before the visual style
A timeline can explain event order, but evenly spaced milestones do not necessarily represent equal time intervals. If spacing is only a layout choice, say so rather than implying elapsed duration.
For quantities encoded by bar length, a shared scale starting at zero is a useful default. For a part-to-whole graphic, first establish whether the categories belong to the same total, do not overlap, and cover that total. If they do not, a complete pie chart would suggest a relationship the data does not support.
Also separate percentages from percentage points. This is an arithmetic illustration, not observed business data: 40 out of 200 and 60 out of 300 both equal 20%. A count increasing from 40 to 60 does not establish an increase in share. A rate moving from 20% to 30% rises by 10 percentage points, or 50% relative to its original rate. The headline should identify which change it means.
Resolve these choices in the brief. Do not generate an attractive picture and work backward to a claim that fits it.
Ask AI for a layout concept, not missing facts
A useful visual draft can have a narrow job: explore where the comparison belongs, what the reader sees first, and how much space the final text needs. For example:
> Design a portrait infographic layout for a general audience. Reserve space for a title and one explanatory sentence at the top, a horizontal bar chart with a shared scale in the middle, and units, reporting period, and source notes at the bottom. Use simple icons and clear whitespace. Do not generate statistical values or factual conclusions. Leave chart labels and body copy blank for later typesetting. This is a layout concept only.
This is a request, not a guarantee that the output will comply. Remove any invented values, labels, or citations that appear in the result.
To create a new visual draft, you can enter the brief at InkRoom’s image-generation entry and select a currently configured model. Availability, parameters, and fees depend on the current interface and account configuration. Use it for visual exploration, not as a promise of data verification, exact chart construction, or editable typography.
Finish charts and text where you can control them
Once the layout works, the recommended next step is to build the final chart in a tool that lets you set values and axes explicitly, then add headings, labels, units, and source notes in a layout tool. Generated illustrations can support an explanation, but inaccurate areas, bar lengths, or milestone spacing should not carry quantitative claims.
Review each value as a chain: one row in the brief → one visual mark → its label. Check the value and unit, then check that the legend assigns the right category and that separate panels have not silently switched scales. If rounding makes displayed percentages total slightly more or less than 100%, explain the rounding rather than changing source values to force a neat total.
Do not make color the only way to identify a category. Add direct labels, text, or distinguishable shapes. Inspect small type and pale lines at the actual publishing size, not only on an enlarged design canvas. Translated labels need their own layout check; the same space will not necessarily fit every language.
Keep source notes with the chart they support. Include the organization or author, dataset or report title, table or page, data period, and original link where available. If different panels use different sources, identify them separately. A source note is evidence, not decorative small print, and should never be invented by the model.
Retain both the traceable brief and the final layout file. When the data changes, update the evidence and chart first, then revisit the explanation and visual treatment—without asking a model to guess the facts again.
Related articles and cases
- AI Book Cover Generator: From Story Brief to Typography Review
Turn a story brief into cover concept art without confusing it with a publication-ready file. Learn how to assess the real title, author name, thumbnail readability, series identity, dimensions, and asset permissions.
- gpt image 2.6 gif: a product-loop brief and unresolved API details
Plan a small product animation and inspect its loop, identity, lettering, and dimensions. Official API routes and animation limits remain unverified in the supplied evidence, so this draft does not offer executable requests or unsupported parameter values.
- AI Poster Generator: Turn an Event Brief into a Publishable Layout
Use a hypothetical event to plan the title, date, colors, dimensions, and text space—then separate visual generation from proofreading and layout for each placement.
- AI Makeup Generator: Try the Makeup, Not a Different Face
Preview lip color, eye makeup, and blush on your own photo without confusing a flattering face edit with a useful makeup idea. Includes natural and stage-makeup briefs plus practical checks against the original.